
As a result of reported 7.1% inflation as measured by the Headline Consumer Price Index (CPI), Chairman Powell’s comments on the plan to reduce and stop the Fed’s bond purchases (tapering) was decidedly more hawkish during this past December’s meeting. The Federal Reserve announced the intention to shorten the timetable for stopping bond purchases by three months (i.e., faster tapering).
In plain speak, instead of continuing to buy bonds to inject cash into the financial system through June, they will wind the program down by March. The hastened pace of tapering makes room for interest rate hikes to come sooner. While no rate increases occurred at the Fed’s January meeting, the market is anticipating a rate hike at the March 16th meeting of at least .25% (25 basis points) and the probability of that rate hike being .50% is rising quickly. The odds of more rate hikes in 2022 have also increased (as many as four more), and with it, some significant volatility in equity markets as of late.
Prior to the Great Recession of 2007 and 2008, the topic of the size of the Fed’s sub-$1 trillion balance sheet was not one of much interest. As seen on the chart, the stimulus provided through asset purchases (treasuries, mortgage-backed bonds, etc.) to revive the economy and keep the financial system functioning created the first jump in the value of assets held by the Federal Reserve. Bond purchases continued through 2014 until Quantitative Easing (QE) was stopped.
At that time, the Federal Reserve held approximately $4.5 trillion on its balance sheet. As the economy recovered and strengthened, the Federal Reserve began letting bonds mature off of the balance sheet without buying replacements. The balance sheet began shrinking slowly until 2018. In 2018 and 2019, the rate at which assets were maturing off the balance sheet without replacement purchases accelerated. Long forgotten, was the fall of 2019.
Before COVID rattled the markets, illiquidity issues started to surface in the money markets and repo markets (repo markets are where repurchase agreements are used by the Federal Reserve to offset temporary swings in bank reserves). The Fed started injecting capital, thereby adding to the balance sheet again in order to keep proper liquidity in the financial system. Then COVID hit and the Fed threw everything, including the “kitchen sink”, at the financial system, taking the balance sheet from a little over $4 trillion to nearly $9 trillion currently.
So, what is balance sheet reduction? Essentially the Fed would be reversing course and making the chart below look more like the time period between 2018 and 2019 when the line on the graph starts to fall. The impact, much like tapering, would be an ongoing process to extract cash from the financial system in an effort to stave off inflationary pressures.
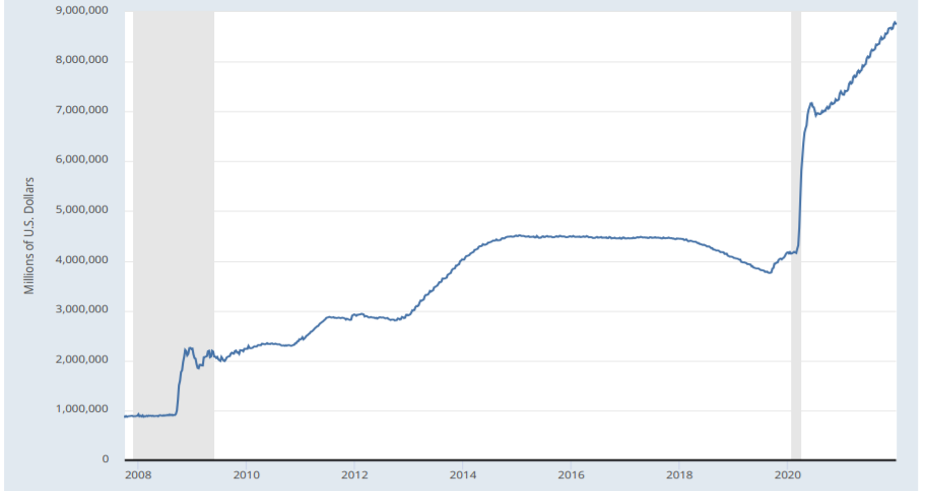
Source: St. Louis Federal Reserve (FRED)
Looking Ahead – Does Q4 of 2018 foretell 2022?
History doesn’t often exactly repeat itself, but it certainly rhymes on occasion. The market’s attention is fixed on inflation and Federal Reserve policy decisions. A policy error is in the making and it could sting markets badly. To understand why, we must look back, specifically to a somewhat similar time in recent U.S. financial market history.
After the Great Recession of 2007/2008, the Federal Reserve held the overnight lending rate (Fed Funds Rate) near 0% for seven years from December 2008 to December 2015. There were two initial rate hikes in December of 2015 and December of 2016. In 2017, the Fed picked up the pace, raising 3 times. Four rate hikes followed in 2018 (March, June, September, and December) putting the Fed Funds Rate at 2.5%. Lastly, in their December meeting, the Fed announced intention to raise two more times in 2019.
GDP growth had peaked in Q3 of 2018 and began to slow in the fourth quarter. (For reference, the 10Y Treasury yield hit 3.25% at the end of Q3 2018 and then started to decline. The bond market almost always gets the big moves in the economy correct before the stock market catches up, or in this case, catches down). The September and December rate hikes were into a slowing growth set up and the equity markets responded with a rapid selloff (the S&P 500 declined 13.5% in Q4). Following the Q4 2018 sell off, markets eventually stabilized and recovered by the end of Q1 2019, but the middle of the year brought renewed market choppiness and a stalling economy. The Fed reversed course, cutting rates three times in 2019 in August, September, and October. The year ended with the Fed Funds rate sitting at 1.75%.
Why does this matter? At present, U.S economic growth, inflation, and the Federal Reserve policy stance is a similar setup. Despite increased complexity, as compared to 2018 because of the pandemic, one thing remains the same; the Fed’s intention to raise rates into a slowing economy. Doing so has the potential to be highly disruptive to market valuations.
This, in my opinion, should be the number one concern of anyone with exposure to stocks in 2022. Federal Reserve policy is behind on inflation, but unlike 2018, inflation is much higher and much more politicized. There is pressure to act, but they waited too long. Will they go through with multiple interest rate hikes this year? Will they raise rates too aggressively and end up cutting rates later in the year? Time will tell, but it would not be unprecedented for Chairman Powell to walk back this current hawkish positioning to placate the equity markets once again.